Web Performance covers the speed and health of your business funnels. How fast pages will load is an extremely important matter for the overall User Experience on a digital interface. Thus, in the case of an Ecommerce store it will impact its conversion rate and business results.
Therefore, it should be closely monitored! But then, which metrics should you follow? Loading time, Speed Index, Page Speed Score… many key performance indicators are available. How to use them and which ones better represent the User Experience?
Here is a little tour of the main Web Performance KPIs that should catch your attention.
Loading time: a basic metric, but a little outdated
Loading time has been the first performance indicator used. It simply represents the overall loading time of a page (until the last pixel is displayed).
It is interesting to follow this indicator but it does not represent the customer experience. The main reason for that is that a page is usually displayed progressively and become interactive before being fully loaded, which makes the user feel like the page was loaded before the total loading time was reached.
Speed Index: a weighted measure of loading time
The Speed Index is a measure of the display time that takes into account the actual user experience. It is expressed in milliseconds. A low score means a fast display and therefore a better user experience. Concretely, the speed Index represents the average display time of all pixels above the bottom of the screen.
Let’s take an example:
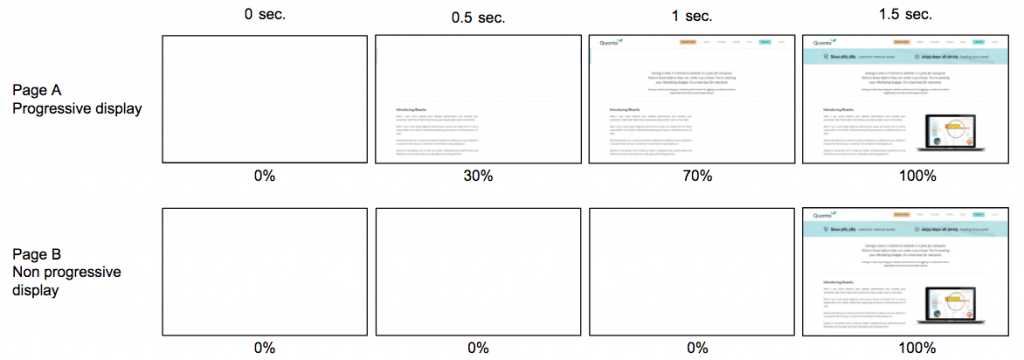
Page A is displayed progressively (30% of pixels at 0.5 seconds, 70% at 1 second and 100% at 1.5 seconds) vs page B which is displayed in one time (0 to 100% at 1.5 seconds).
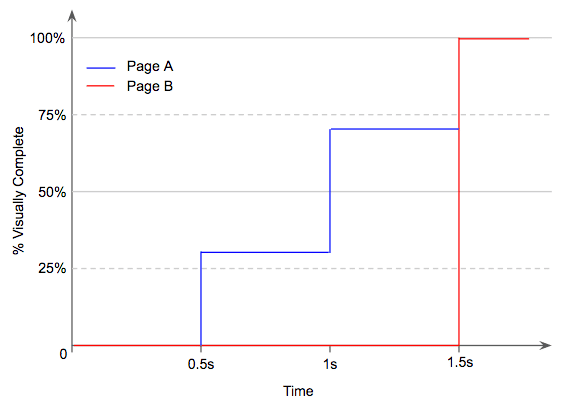
Page A and Page B will have the same loading time (1.5 seconds). However, the user experience will be much better on page A.
In the case of page A, as the page is displayed gradually, it has a double positive effect for the user:
- He has a visual confirmation that the page is loading: it helps him to wait and keeps him focus on the page.
- He can already use some of the page contents: the loading time is no longer “lost”.
The Speed Index calculation will take this difference into account to favor the progressive display. Thus, Speed Index page A will be 1000ms when the one of page B will be 1500ms.
What is a good Speed Index?
It is commonly accepted that after a 1 second wait, customers will lose their train of thought and their purchase intent. After 3 seconds, more than half of them will leave the site out of frustration. Therefore, a good Speed Index should ideally be (and stay!) under 1000ms. Between 1000 in 3000ms, the navigation remains “acceptable” but fragile. And above 3000ms it is absolutely necessary to improve it as the risk of losing visitors if becomes very high.
Page Speed Score: a best practice compliance indicator
The Page Speed score is a very different indicator. It does not represent the loading time, but Google’s best practice recommendations.
This score is a global grade out of 100 and made up with the compliance grades of each different best practices.
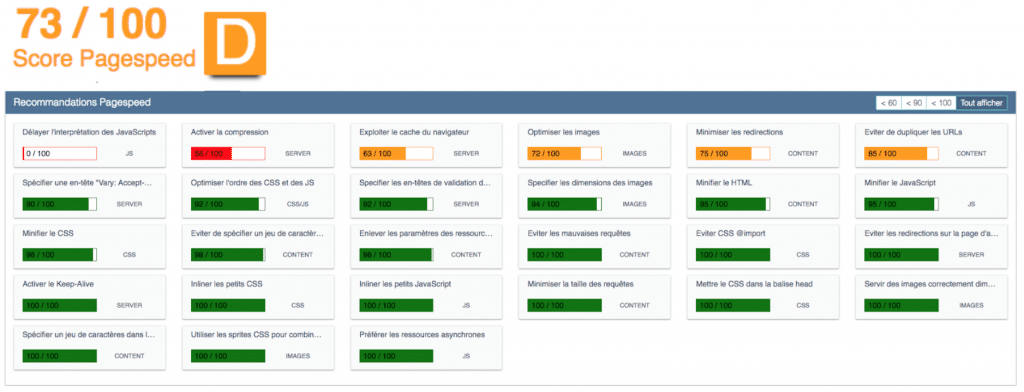
Thus, Google Page Speed is not an indicator representing the user experience, but rather a tool that will highlight optimization opportunities. It is very complementary to other KPIs as following your PageSpeed score will help you build the optimization roadmap to ultimately improve your Speed Index and User Experience.
As a conclusion, there are many indicators to track the Web Performance of your pages. But in the end, what you need to follow the big picture which is “how is my User Experience?”. To answer this question, the Speed Index is the reference. On the other hand, once you have identified which pages need to be improved, you need to know what to do next to be able to improve, and this is when the Page Speed score makes the most sense.