Web Performance Management
For Business, Uninterrupted
For Business, Uninterrupted
A Shared Web Performance Monitoring Interface for Your Full Team
Get your full team — management, marketing, IT, agency, hosting provider — working together to boost web performance and continuously track the revenue impact of all actions.
Everyone can see in real-time the speed of all components in your e-commerce stack: hardware, databases, app servers, e-commerce packages, network, and web rendition layer. Incidents are resolved quickly with no finger pointing. And because the intuitive Quanta interface also informs everyone of the impact of web performance on revenue, your full e-commerce team rallies behind the business like never before.


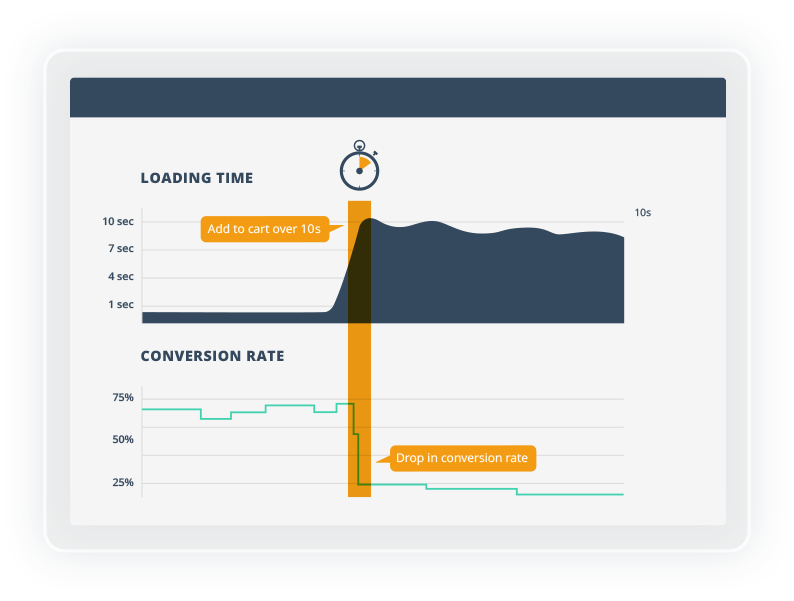
Monitor page speed
and conversion
and conversion
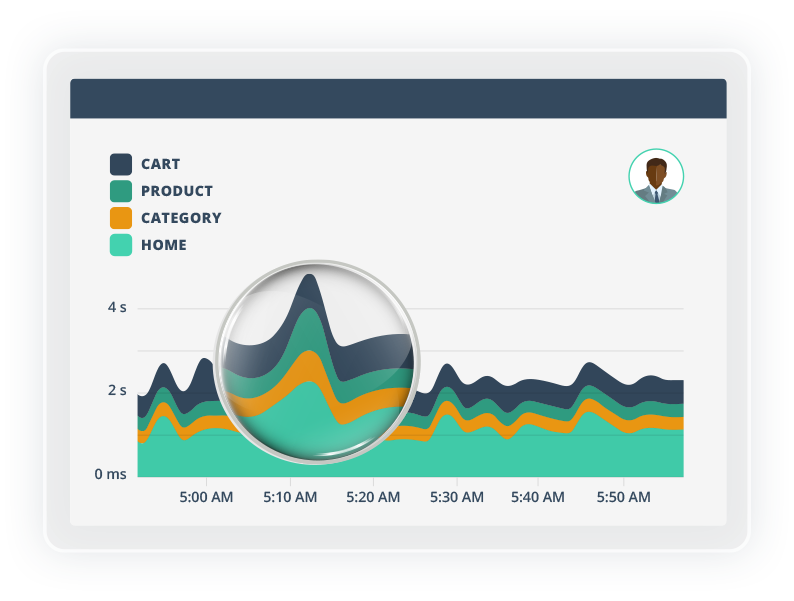
Quanta’s visual timeline enables everyone in the e-commerce team — executives, IT, marketing, agency, hosting provider — to monitor the millisecond-level loading time of your key web pages, and zoom in on time used up by individual software and hardware components.
Updated in real-time, the Quanta timeline enables stakeholders to troubleshoot performance incidents as they happen, work together like never before, and prioritize their actions based on expected revenue impact.
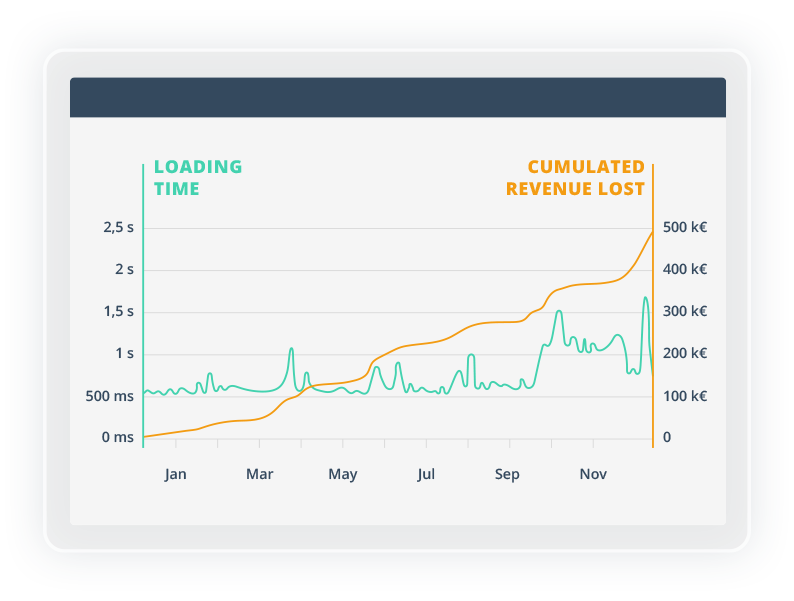
Understand the impact of web performance on your business
The intuitive Quanta timeline indicates the time it takes to serve all your key web pages within specific funnels split by technology components. The timeline also clearly calls out estimated revenue lost to poor performance.
- Share a single point of truth with both business and technical team members.
- Explore trends with one-click simplicity. Troubleshoot incidents by zooming in on any given technology layer (server, application, database, networking, browser, etc.) to see time used up by its own sub-components (for instance, individual services in a given application).
- Make informed decisions to protect revenue now. Prioritize future technology investments based on anticipated ROI.

“We now have visibility and control of a mission-critical aspect of our e-commerce operations.”
— Olivier Conq, CIO, 24sevres.com
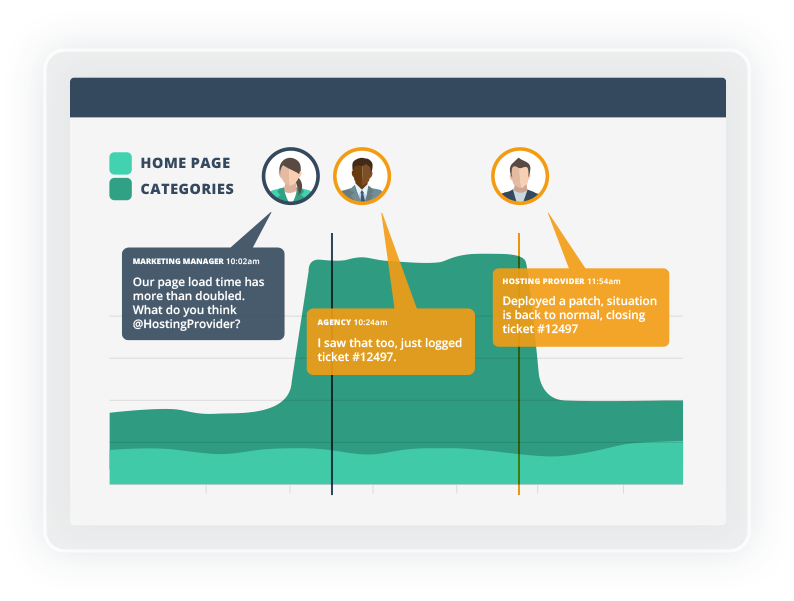
Collaborate across
distributed teams —
and no finger pointing
distributed teams —
and no finger pointing
When performance issues would strike, your teams could spend 80% of their time and energy looking for who or what was responsible before even considering a resolution. Now, with Quanta, you can foster teamwork and put an end to frustrated teams scrambling to find relevant information.
- One-click root cause exploration by business and technical staff alike.
- Set up customizable alerts and route them to the appropriate persons via email, SMS, Slack or directly in any app you already use.
- Enforce an audit trail of all work performed on individual software and hardware components with ability to synchronize data sources automatically.
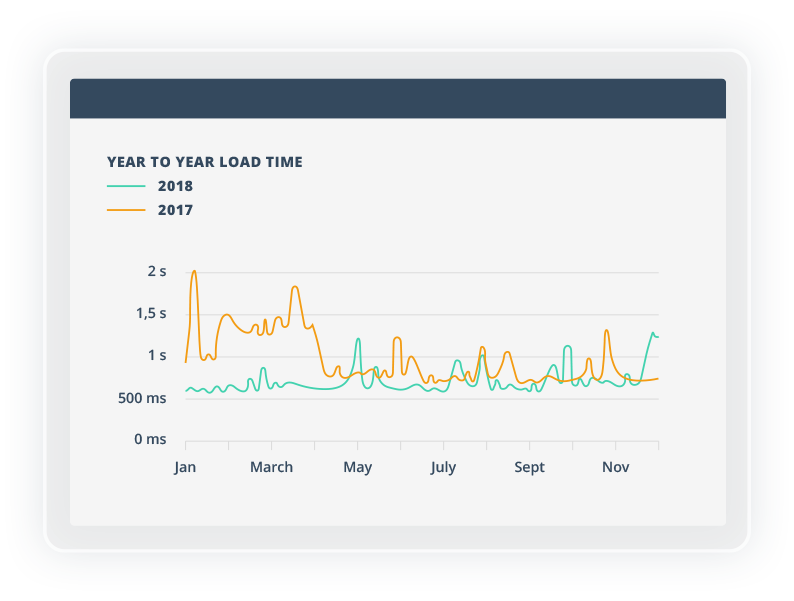
Tailor the platform
to your specific needs
to your specific needs
Quanta enables you to fully customize the platform and how it is connected through a system of widgets and configurable data feeds.
- Monitor the KPIs and timeline views that make the most sense for your business role.
- Connect and correlate all your technical data sources — from network beacons, platform data, through to Google Analytics and everything in between.
- View history back to two years and make like-for-like comparisons over time in your retail calendar.

“It’s now very easy to track site performance for individual marketing profiles. It has become an indispensable daily driving tool.”
— Céline Malgras, Chief Digital Officer, Guy Degrenne
Fix your problems and save the day with expert powers
Quanta offers you exclusive tools, KPIs and visualizations to give you the expert powers you need to optimize your online business. Even the least technically oriented users can explore and understand root causes with ease.
- Infrastructure Cost Per Click: Understand the technical cost and trend of serving a page at any given time. Monitor your efficiency in serving customers over time.
- Multiple Timeline Overlays: Overlay and explore multiple visualizations with drag-and-drop ease. Correlate events and performance variables (CPU load, revenue by minute, page views per minute, etc.)
- Customizable events: See how the actions of your technical team impact your KPIs, such as updates to application code, server restarts and CDN configuration changes.
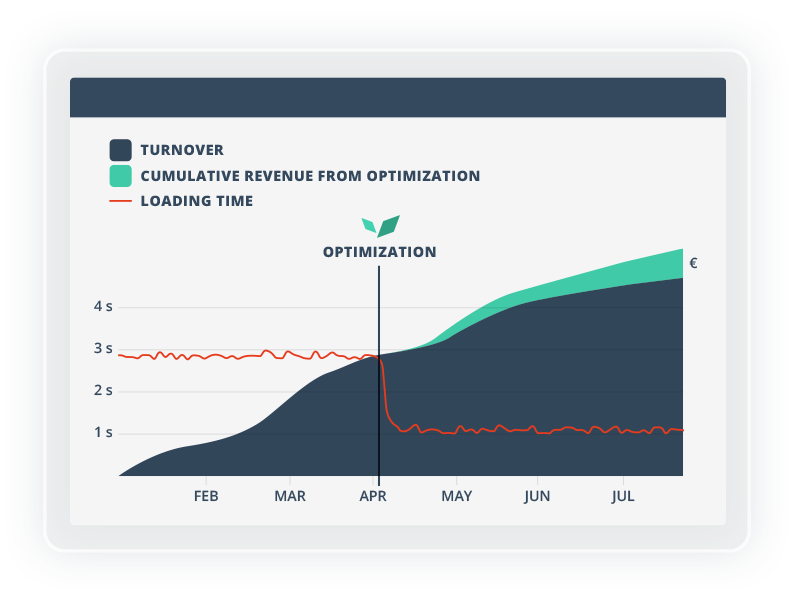
Measure revenue gained from performance optimizations
Quanta offers full audit trails, automatic anomaly detection and alerts to avoid bumps in the road and keep the customer journey rolling.
- Apply signal analysis to automatically surface anomalies.
- Project Revenue Impact: Visualize cumulative revenue earned from optimization over any time period.
- Top Pages Benchmark: Instantly assess revenue impact and opportunities for your key pages.
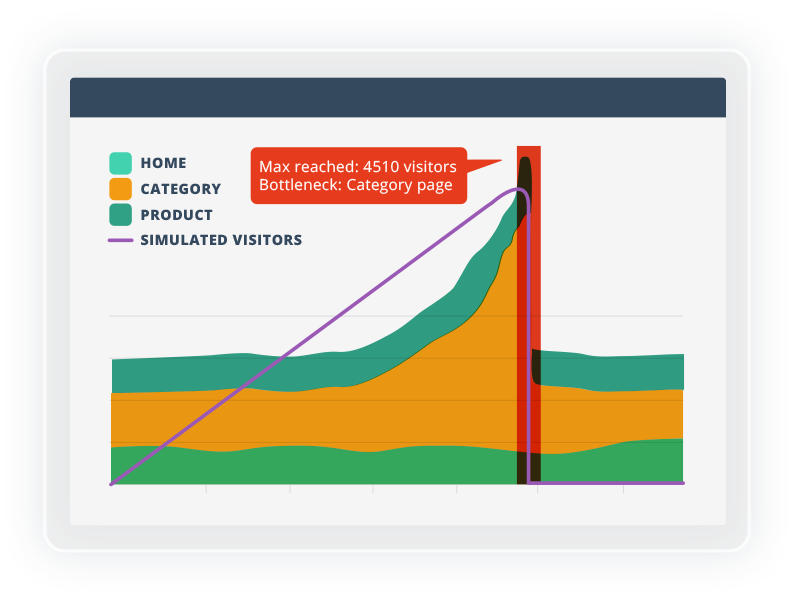
Ready your business
for peak traffic
for peak traffic
Don’t get caught off guard. Quanta lets you run automated load tests, as often as you like so you ready your business for peak traffic.
- Target specific areas of your web site, without going through the expense and hassle of running full-scale load tests.
- Customize your simulated transactions in terms of length, number of users, and whether they are signed in or not.
- Simulate denial-of-service attacks and other scenarios.
Quanta Web Performance Services
We’re on your team
Our gurus provide on-demand expertise to better manage your service providers, identify areas for optimization, and help solve problems faster. Acting as members of your virtual team, we follow the same alerts as you, provide incident reports and can even act as a go-between with your partners.
CONTACT US
for a 3-day comprehensive audit
Covering every aspect of your web performance and receive a roadmap.
We provide:

In-depth code reviews

Critical path analysis

A view under the hood of your infrastructure

A benchmark of your processes and actual performances with those of your peers

A list of quick wins that you can implement straightaway

“Quanta ensures that the sites are always live and proactively reports any issues, all without needing a development team.”
— Gautier Dudault, Digital and E-commerce Director, FBD Group
Serenity now
Quanta provides improved oversight, a transparent resolution process and clear-eyed teams working together around the clock — all for seamless customer experiences, measurable revenue growth and a demonstrable ROI.