It’s been a while, but we’ve finally decided to make a new blog post about our exciting new features!
It’s not that until then, no new features were created; but up to this point, our amazing (yes, amazing!) tech team has been working in the shadows. But, no more. No more! From now on, we’re going to tell, loud and clear, all of our amazing team’s feats.
So, for this week’s new features, we’re going to talk about the new “Dashboards” menu (signaled by this icon ![]() ), which contains the Business, and Favorites tabs.
), which contains the Business, and Favorites tabs.
Without further ado, let’s push ahead!
Dashboards : Business
The first new feature on our agenda today is: the Business dashboard.
From now on, in QUANTA, you’ll find a new menu, called “Dashboards”, with two different tabs in it. And the first one, as you’ve guessed, is “Business”.
The Business dashboard features 4 different widgets, essentials to the marketing experts, head of e-commerce, and other business moguls:
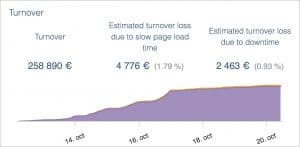
- Turnover: Using past and current turnover data, this widget estimates the turnover loss due to slow page load times, and downtime. Simply said, the Turnover widget helps visualise the loss in income, due to unavailability and slow response of the website. It is a useful widget when trying to estimate the cost of a technical incident on the online store.
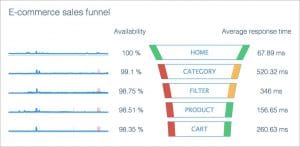
- E-commerce sales funnel: It’s quite simple actually! This widget monitors the availability and average response time, of each step of the classic sales funnel (Home > Category > Subcategory > Product > Cart, for those who weren’t following 😉 ) on your website. As we’ve said before (and we’re not the only ones to say that, Google and Amazon did before us!), time is money. And in terms of e-commerce, longer loading times equal to loss of money. So it is a must to monitor the web performance of each step of the sales funnel, simply put, to keep customers.
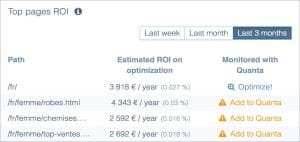
- Top pages : It lists the top 10 most viewed pages of your website thanks to Google Analytics, and estimates the additional revenue you could gain after optimization, based on their response time, traffic and a bit of our magic. For example, if your Home Page views turns out to represent 10% of your total viewed pages, then it is in your best interest to concentrate your optimization on it, in terms of SEO, load time, availability, …etc. 10% seems to be a small slice in the cake, but if optimizing it could result in thousands of euros in additional revenue, each year…
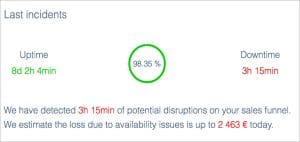
- Last incidents: This widget is a simple abstract of all the technical analysis that are already available in Quanta. If you don’t have time to look at all the graphs outlining problems with your CPU, ping time, server load, …etc., just sneak a peek at this widget and you’ll know exactly what was the uptime and downtime of your e-commerce website, during a given time period. Let’s be clear, if the numbers are in the red, then that means it’s high time to optimize web performance, and call in the experts of your tech team. This widget also estimates the loss due specifically to availability issues.
The Business dashboard is completely customizable. It allows you to easily get a quick glance at what interests you the most, whether it is availability (Last incidents widget), SEO ( Top pages widget), …etc.
The gif below gives a quick tour of the Business dashboard so, enjoy it! But the best way to discover these 4 widgets and find out if they can be helpful in your daily tasks, just log in to your Quanta account and test it out.

Dashboards : Favorites
The idea behind the Favorites dashboard is to allow our users to draw a parallel between seemingly unrelated graphs from our monitoring tool.
Let me explain.
In Quanta, you can find analysis, on any number of subjects, technicals or not. This different analysis are then classified under several tabs: Availability, Performance, Load Tests, Business, Network, System and Web scenarios. But these tabs are just a matter of organisation and presentation.
If you want to draw a parallel between the Transaction revenue per minute (Business tab) and the Average load time per page (Web Scenarios tab), and the Availability (Availability tab), because you’re smart and want to find out how much the last incident cost you !!!!!, then you just have to tag these 3 graphs as Favorites, and find them displayed in the Favorites dashboard.
There, you’ll be able to analyze them precisely, identify technical problems, and demonstrate to your marketing and technical teams the link between a well maintained and optimized website, and a comfortable profit.
If you want a quick tutorial on the Favorites dashboard, just have a look at the gif below.

And with this, our tour of this week’s new features comes to an end! I really hope you liked it, and that you’ll find our new marketing-oriented features to be of interest.
Two blog posts on new more technical features will follow, because we’ll soon do a piece on PHP 7 / Magento 2 / and other surprises, and a more thorough one on the Varnish 4 update.
And keep in mind that everything you need to know about how to use Quanta is explained here!