Quanta’s teams never rest when it comes to pushing ever further the boundaries of web performance!
And what better way to be more efficient strategy-wise than to personalize the tools necessary for the creation of said strategy? As we always say, and repeat: to improve the web performance of a website, it is important to know the profile and behavior of its users.
It is with this idea in mind that Quanta’s Tech Team wanted to refine Quanta’s analysis tools. It will now allow you to:
- Personnalize Quanta, based on your needs,
- Refine your strategy thanks to new indicators.
And for this first batch of new features, we chose to focus on frontend monitoring.
New frontend options
In the settings window for your web scenarios, “Scenario edition”, new options are available for the frontend monitoring.
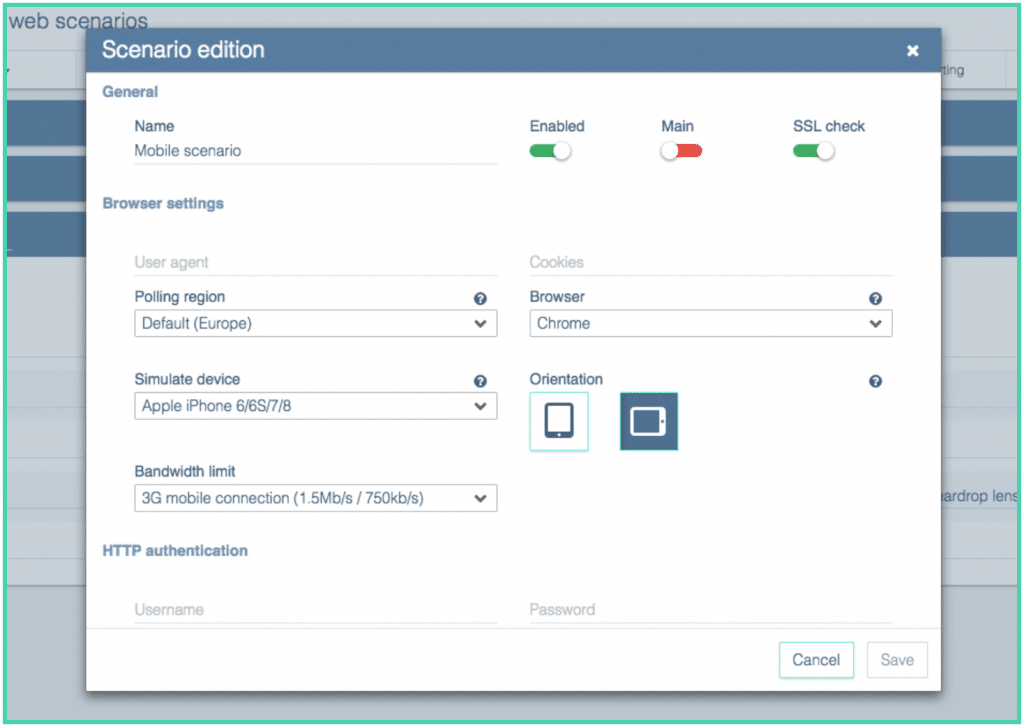
New options in the web scenarios settings
With these new options, you will be able to:
- Choose the browser</strong
As previously announced, we made the decision to change the default browser used in Quanta. As of September 1, 2017, Google Chrome is used by 63.98% of Internet users, so we considered that it was more representative of user profiles in general. However, the Firefox option is still available, in the “Browser” drop-down menu! The choice of browser allows you to compare the measures between Firefox and Google Chrome, and choose the browser that your users use the most.
- Choose the polling region
You now have the possibility to choose from which region of the world you want to measure data, using the “Polling region” option. This allows you, for example, to take measurements closer to your users, or to test the effectiveness of your CDN.
- Simulate a mobile device
In order to more accurately measure the loading time of your pages on phone or tablet, you can now simulate a mobile device, with the “Simulate device” option. Note that the emulation is done using the browser simulator (which works by replacing the User-Agent and the screen size); mobile hardware performance is therefore not taken into account. In addition, you can also choose the orientation (portrait or landscape) for simulated mobiles.
- Limit bandwith
To allow you to simulate the behavior of a mobile user more accurately, we’ve added an option to limit bandwidth when running web scenarios. This option (“Bandwith limit”) is available in the advanced configuration of the scenario, and allows you to simulate different types of connections. This parameter is taken into account by both our back-end probes and our front-end probes.
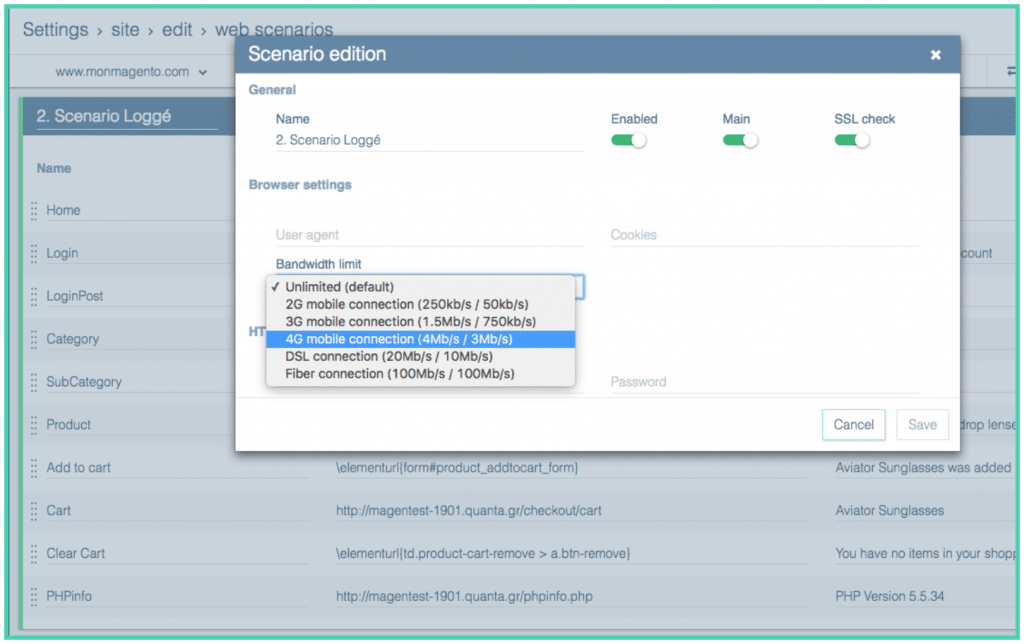
Detail for the bandwith limit option
New frontend metrics
We added several metrics to the frontend metrics, which you can now find on the waterfall page. In order to help you make the most of these new metrics, we have associated a rank system, which will allow you to position yourself in relation to your competition.
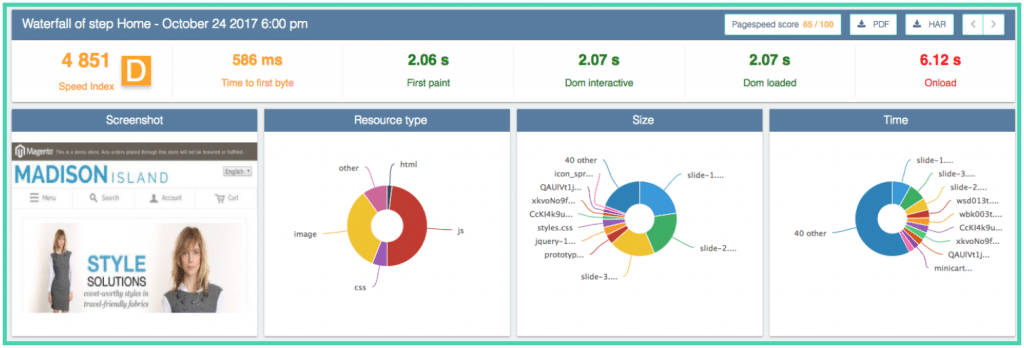
Waterfall view of the Speed Index and Detailed loading times
In addition to all the features already available, you can now use:
- The Speed Index
The Speed Index is a crucial indicator when talking about web performance.
This indicator highlights the loading pace for displaying the different elements of a page.
In other words, if you analyze 2 pages with the same number of elements, and the same Start Render and global loading time, the Speed Index will help you to determine which one is the most web performant between the first, with 80% of its element being loaded in 1sec, and the second, with 20% of its element being loaded in 1sec.
The Speed Index is expressed via an overall score: the lower the score, the faster the page is displayed.
- The detailed analysis of a loading page stages
With Quanta, you could already see the overall loading time and the DOM loading time. But we decided to highlight the time spent before the reception of the first octet (TTFB), and added the time spent before the Start Render (when the user is no longer faced with a blank page).